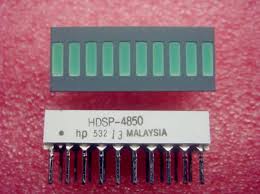
The bar graph is basically a series of LEDs in a line, this is a common hardware display for analog sensors. It’s made up of a series of LEDs in a row, you simply treat these as you would do if you had various LEDs. The example I have is a 10 way green type
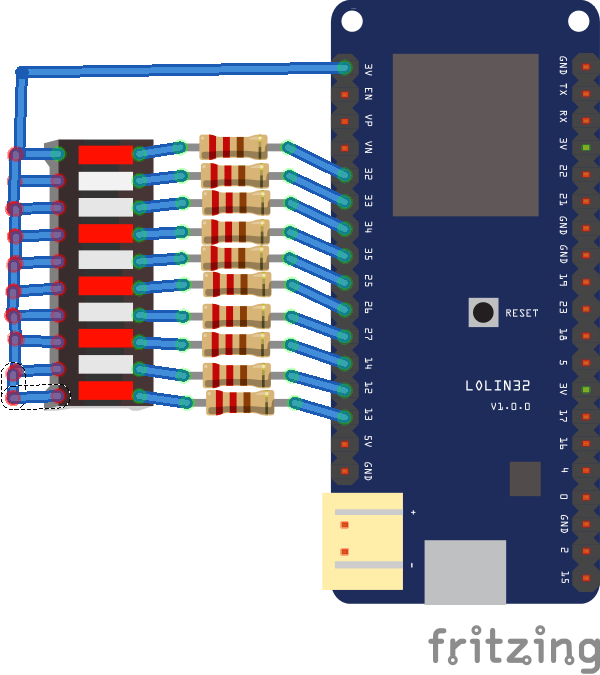
Layout
Basically the anodes are linked together to 3v and all the cathodes are connected to an individual pin
Code
[cpp]
const int ledCount = 10; // the number of LEDs in the bar graph
int ledPins[] = {
32, 33, 34, 35, 25, 26, 27, 14,12,13
}; // an array of pin numbers to which LEDs are attached
void setup()
{
// loop over the pin array and set them all to output and high
for (int thisLed = 0; thisLed < ledCount; thisLed++)
{
pinMode(ledPins[thisLed], OUTPUT);
digitalWrite(ledPins[thisLed], HIGH);
}
}
void loop()
{
// loop over the LED array:
for (int thisLed = 0; thisLed <= ledCount; thisLed++)
{
digitalWrite(ledPins[thisLed], LOW);
delay(500);
}
for (int thisLed = 0; thisLed < ledCount; thisLed++)
{
digitalWrite(ledPins[thisLed], HIGH);
delay(500);
}
}
[/cpp]
Links
A cracking deal – 20 different bargraph LED modules for under $8
20LED Bars 5/8/10/12 Segment 5pcs Each Red LED Bargraph Segment LED Module LED Display